
|

My pages are an introduction to what I do at Bates, with information on fractals, bifurcation and orbit diagrams, Julia sets and more. Also, check out my galleries of fractals, people, pipe organs, flowers, and other interests. Years listed in red are an indication of the relative newness of the subpages. Newest pages are the bifurcation pages (here at the top) and flowers (scroll down to the bottom). |
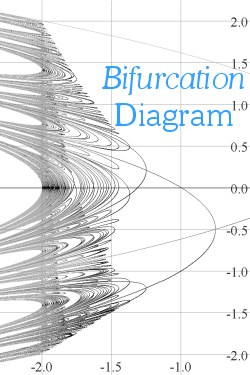
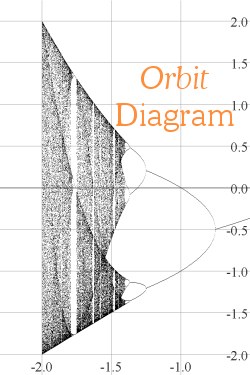
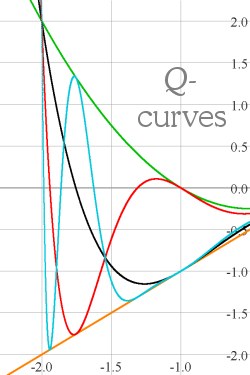
We'll begin with a note about Bifurcation and Orbit diagrams. Plots of these two diagrams for the family of functions fc(x) = x2 + c appear below. The shadowy curves sweeping up and down through both diagrams are called "Q-curves"; we'll say more about them in a moment.
|
|
|
The orbit diagram of the middle picture will probably look familiar. At each value of c on the horizontal axis, it shows how the orbit of 0 behaves after many iterations and in doing so, shows where fc has attracting cycles and suggests where fc behaves chaotically. This image has appeared in countless books and webpages, and indeed ``has become the most important icon of chaos theory''PJS.
The bifurcation diagram in the left-hand picture may not be so familiar. It shows the locations of all attracting and repelling cycles of fc (up to period 8 in this figure).
Clicking on either picture brings up a
page with information about both diagrams, [2004] and the
bifurcation diagram in particular, including the algorithm used to draw it. Pictures of bifurcation and orbit diagrams for other functions such as the logistic map and
sin(cx) are included.
Now, please be careful! The names I am using for these two diagrams are also used by authors such as Devaney, Strogatz, Peitgen/Jürgens/Saupe , but there are many books, articles, and webpages where the orbit diagram is called ``the bifurcation diagram'', and that which we call the ``bifurcation diagram'' is not discussed. One can also find places where bifurcation diagrams are discussed, but then computer-drawn orbit diagrams are used in the illustrations without any mention of the difference(!). However, I have been unable to find any other sources of detailed, computer-drawn bifurcation diagrams. Our images show that computers can draw excellent pictures of both diagrams, and both are repleat with fascinating features.
One such feature shared by the two diagrams is the illusion of shadowy polynomial curves - Q-curves - sweeping up and down as you look left-to-right across either diagram. These curves are not implicitly drawn in either diagram, and in fact appear as illusions in the two diagrams for nearly opposite reasons. The Q-curves interact with the explicitly drawn curves of the bifurcation diagram in a beautiful way, and this interact is the subject of an article we've called "The Shadow-Curves of the Orbit Diagram Permeate the Bifurcation Diagram, Too" (Download a PDF copy). This paper appeared in the September 2009 issue of the International Journal of Bifurcation and Chaos.
Click here for a quick, illustrated introduction to this interaction.

|
It's Here! The preliminary version 0.00 of my Windows program OrbitsXP is ready to download; visit the download page. Please try it and report any problems and/or suggestions to me at sross@bates.edu. Try It! [2005] |

|
Here is an illustrated description [2005] of some of the capabilites of OrbitsXP, which is used to produce the newer pictures on this website. |
|
My coauthor Jody Sorensen and I were pleased to see our
article "Will the Real Bifurcation Diagram Please Stand Up!" appear as the cover article in the January, 2000 issue of
The College Mathematics Journal. It is in this article in which the
similarities and differences between the
orbit diagram
and the equally beautiful
bifurcation diagram
are discussed, and the algorithm for drawing the bifurcation diagram is detailed.
Download a PDF copy
In August of 2001, Jody and I were honored to be chosen to receive the Mathematical Association of America's George Pólya Award for this article! Visit the MAA website for more information about its awards. Click here [2001] to visit my CMJ supplements page, for more information about and illustrations of the orbit and bifurcation diagrams, download my DOS program "orbits.exe", and get html help files for "orbits". |

|
Visit this page [2001] for information and pictures about fractals. Julia sets, the Mandelbrot set, an animated 3D rendering of the Lorenz Attractor, cauliflower, and Pipe Organ!? examples can all be found here. (Note: scroll down further for the High Street Organ Page) |

|
Check out my fractal gallery for various images of the Mandelbrot set and some Julia sets, colored in various useful ways. [1997 but still pertinent] ( Index ) |

|
Since 1991 I have served as organist for High Street Congregational Church, in Auburn, Maine. Our organ is a Skinner pipe organ, and it sounds wonderful in the reverberant sanctuary. Visit this page [2009] for a little history of the organ, the stop list, and some interesting pictures, including the internal pipework, a visit to a much bigger organ, and more! |

|
Pictures of our family's pets, including Bailey the dog and the "destroyer" parakeets can be found here. [2004] |

|
Some pictures of me with my students [2004] . |

|
One of my favorite hobbies is taking pictures of flowers. Here is a gallery of some of my pictures [2007] . I hope you enjoy them. |
Unless otherwise noted, all photographs and diagrams throughout this web site were made by me, Chip Ross - with the general exception of pictures in which I appear! All images by me © 2007. Please contact me if you would like to use them for whatever reason.
|
© 2011 by Chip Ross Associate Professor of Mathematics Bates College Lewiston, ME 04240 email: sross@bates.edu (note: the first letter is an "s"!) sross sross sross sross NOT cross! NOT cross! NOT cross! For technical reasons beyond my control! |