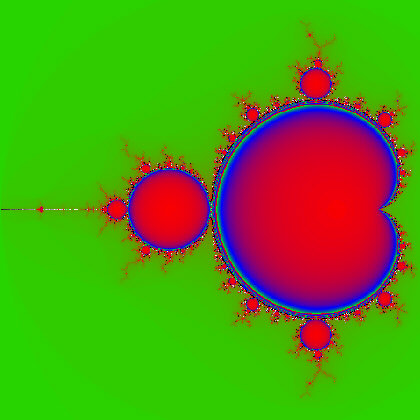


Usually pictures of the Mandelbrot Set are created by coloring points "outside" it according to how many steps it takes them to "escape to infinity", while points inside are left black.
In this image, a point C on the "inside" gets colored according to how many iterations it takes for the orbit of 0 to become sufficiently close to the attracting cycle sported by the Julia set associated with that value of C. Attraction times are shortest near the middle of the bulbs and main cardiod, and increase as you move towards the boundary.

|
|

|

|