Given N, OrbitsXP plots all points of periods 1 through N, points whose periods divide N, or just points whose prime (ie, lowest) period is N.
|
|
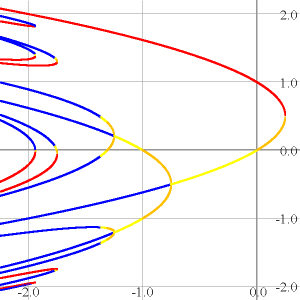
Use of color in bifurcation diagrams...Here points of periods 1 to 4 for fc(x) = x2 + c are plotted according to the slope of the nth iterate. Red and blue for slopes bigger than 1 or less than -1 (resp) indicate repelling periodic points. Orange and yellow for slopes from 0 to 1 or -1 to 0 (resp) show attracting cycles. |
|
|
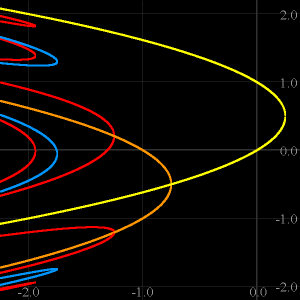
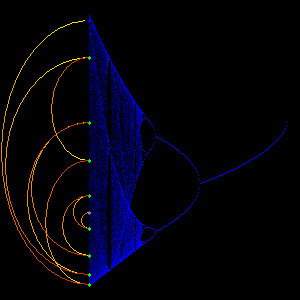
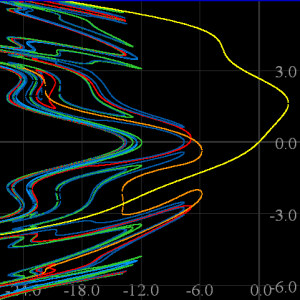
Another use of color in bifurcation diagrams...Here points of periods 1 to 4
are plotted according to the prime (lowest)
period of the point. Yellow, green, blue, red here show points of periods 1,2,3 and 4, respectively.
Plotting on black backgrounds brings out the colors on website or slide presentations; white backgrounds are for printed diagrams.
Given N, OrbitsXP plots all points of periods 1 through N, points whose periods divide N, or just points whose prime (ie, lowest) period is N. |
|
|
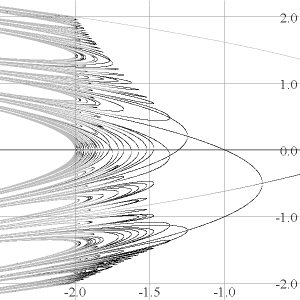
Here is a somewhat more detailed bifurcation diagram, showing points up to period 8. |
|
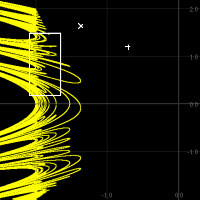
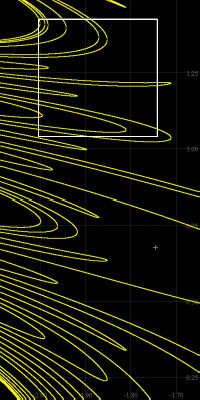
Points of a single prime period can be plotted. Only points of prime (lowest) period 8 are
shown here. It's easy to make "zooms" with the cursor box; drag it to the desired shape and location
using the mouse and precise location and shape via the arrow keys. The picture below this one is the resulting "zoom".
You can climb back out of zooms as each level's parameters are remembered. Cursor box locations are also recalled making it possible to trace back down into a zoom as well. The "+" is a precision cursor that can be dragged around by mouse and then put into precise location with the arrow keys. (The "x" is the usual windows cursor). [They don't look too good in these jpeg reductions, sorry!] |
|
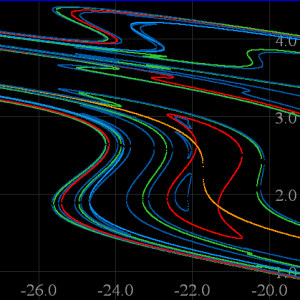
This whole picture is the zoom into the white "cursor box" rectangle
of the picture above. OrbitsXP pictures can be
drawn in any ratio; here the height is twice the width to match the zoom.
There's a new zoom cursor box in this picture as well, and the resulting zoom is below.
OrbitsXP draws pictures in sizes from 150x150 pixels to over 3600x3600 - much too big to fit on a computer screen, but useful for very detailed printing.
|
|
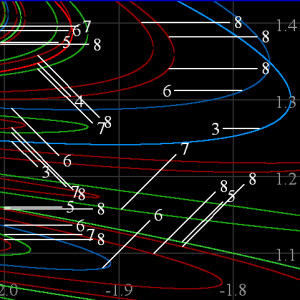
Here's the zoom from the picture above, only we've plotted all points up to period 8. The prime (lowest) periods of the points can be automatically labeled by OrbitsXP as shown here. Two period doubling bifurcations are thus illustrated: one "3-to-6". The other is harder to see... | 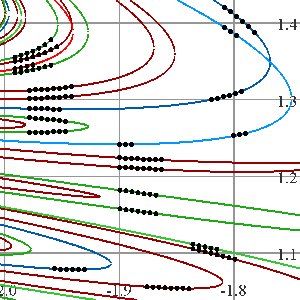
|
This is the same picture as above, only with a different way of labeling periods. |
|
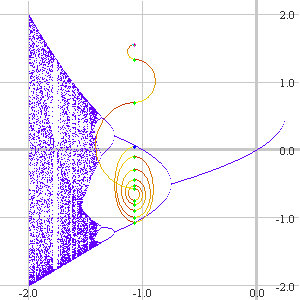
Of course, OrbitsXP can draw the usual orbit diagram. It can also plot the actual orbits of points on either the orbit or bifurcation diagrams, as dots or a "phase portrait". Here we plot the orbit of a point near the repelling fixed point at the top of the image. It moves away (down) and lands near the other repelling fixed point, then becomes attracted to the two-cycle. |
|
Here's a "density plot": pixels are plotted brighter as more and more representing how many times they've been "hit" by an orbit... We've also drawn another phase portrait showing chaotic behavior at c=-2. This orbit starts at a value slightly less than 2. The left/right pattern of phase portraits is user assignable. |
|
In an auxiliary window, OrbitsXP animates in real time the graph of fcN(x) for the
value of C under the main window's cursor as the cursor is moved around. The animation is utterly smooth; much
better than the .gif animation shown here, but this animation gives the idea.
This .gif animation simulates how the graph of the fourth iterate of x^2+C evolves as the cursor across the screen from c=0.4 to -3. This animation has some 35 frames; the actual animations would have hundreds. |
|
Another of OrbitsXP 's tasks is to plot functions y=fC(x) and their iterates in the
usual way, with the horizontal and vertical axes representing x and y.
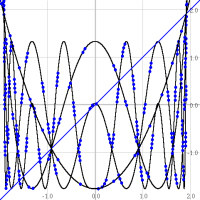
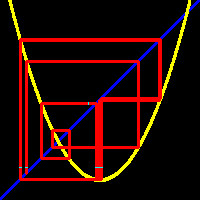
In this figure the first four iterates of f-1.76(x)=x^2-1.76 are graphed. "Fat dots" can be used to mark the iterates, eg four dots on a curve mark it as f ^4. Here you can see where the points of prime period 2 are, for example, by
observing where f ^2 and f ^4 , but not f itself, intersect on the line y=x (near the points (0.5, 0.5) and (-1.5, -1.5)).
"Shallow" slopes at the crossings of f ^3 also suggest that this function has an attracting 3-cycle. |
|
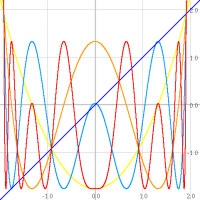
Here OrbitsXP has plotted each iterate in a different color, matching those of the second bifurcation diagram at the top of the page. |
|
OrbitsXP can draw "cobweb" diagrams (left-hand picture), even though I don't think they're too useful - two lines (a vertical and horizontal) for each iterate confuse me. I like phase portraits much better. On the right, a short phase-portrait animation showing the orbit of -1.615 being attracted to the attracting three cycle which x2-1.76 has. Not so clear that the cobweb diagram shows the same thing. |
|
|
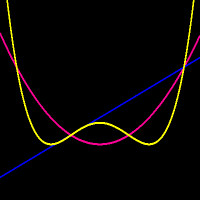
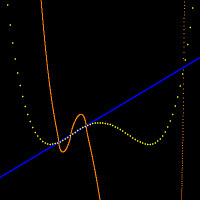
On the left, a function is undergoing a period doubling bifurcation, from period 4 (in fuschia) to period 8 (in yellow). Has the bifurcation occured? It's hard to tell if the period 8 function has crossed y=x two more times. OrbitsXP can exaggerate the distance from a function to y=x. The right-hand image shows the result in orange and we can see (and easily find the coordinates of) the new points of prime period 8. |
|
|
OrbitsXP allows you to type in a function of your choice at run time. Here for example we've asked for a plot of the bifurcation diagram (for low periods) for fc(x) = (x2 + c) / (2.5 + (sin X)2). |
|
Here is a zoom into the above image. There are many interesting features, especially the "closed loops". |
|
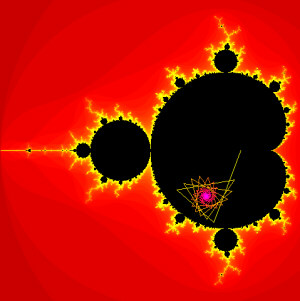
OrbitsXP can draw the Mandelbrot set and make "zooms". This part of the program is still under development - there are many things I plan to add. This picture shows the orbit of 0 for the c value under the cursor. Such orbits are plotted in real time as the cursor is dragged around. |

|
A typical zoom. |
|
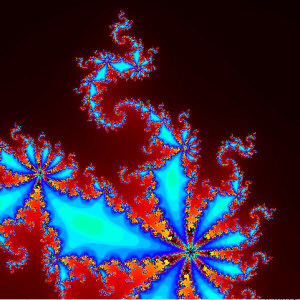
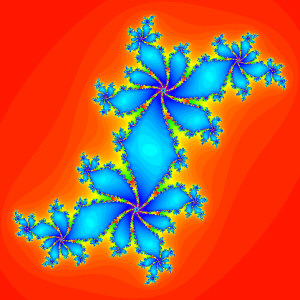
Also under development is OrbitsXP 's capability to draw filled Julia sets. Level sets of points "escaping to infinity" can be colored one way, and those for points attracted to an attracting cycle a different way. Here is a Julia set with an attracting 7-cycle. There are many things to add to OrbitsXP here also, eg, two different ways to locate repelling periodic points. |
|
Another Julia set, also with an attracting 7-cycle. |
OrbitsXP's pictures are saved as bitmap files. These can be brought into any standard graphics program for labeling and resaving in any standard format. As it saves a bitmap file, OrbitsXP also makes another file listing all the parameters' values for later reference. OrbitsXP also reads in text files of parameter values for ease in setting up specific diagrams.
Any reasonable one-parameter family of functions can be etered at run time in the easy-to-use "Post fix notation" format, whereby two operands are given, followed by the operator: eg X+C becomes X C +; X*X+C becomes X X * C +; arctan(X^2+C)/sin(X) becomes X 2 ^ C + arctan X sin /, etc. In addition to the parameter C represented by the horizontal axis in bifurcation and orbit diagrams, four other constants A,B,D and E can be built into the functions.
|
Return to Chip's Home Page
|
© 2005 by Chip Ross Associate Professor of Mathematics Bates College Lewiston, ME 04240 |