
Figure 1. Bifurcation diagram (through period 12).
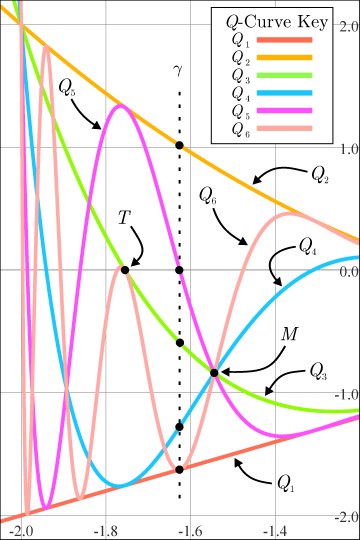
Figure 2. The first six Q-curves.
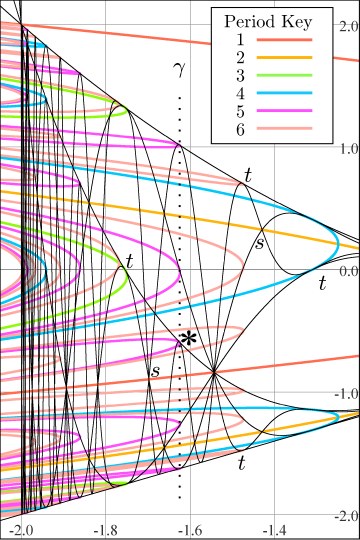
Figure 3. Q and P-curve interactions.
An Introduction to Q-curves in the Bifurcation Diagram
This page is a quick introduction to our article "The Shadow-Curves of the Orbit Diagram Permeate the Bifurcation Diagram, Too". (Download a PDF copy) This paper appeared in the September 2009 issue of the International Journal of Bifurcation and Chaos, published by World Scientific.
Figure 1 is a bifurcation diagram, showing all attracting and repelling points for fc(x) = x2 + c for all periods 1 through 12. We'll call these explicitly drawn curves of periodic points "P-curves". Each P-curve is shaped like an elongated backwards letter "C". The P-curves all reach in from the left side of the figure, turn around (at all the various c's for which a saddle-node or period-doubling bifurcation occurs) and exit left again. Several Q-curves appear implicitly in Figure 1. We've drawn six of them explictly in Figure 2; their formulas are
| Q1(c) = c | Q2(c) = c2 + c, | Q3(c) = (c2 + c)2+c, and so on, until | Q6(c) = (Q5(c))2 + c |
Our contribution to this topic began with the observation that Q-curves also appear implicitly in a computer-drawn bifurcation diagram, like the one in Figure 1. What's more, we found that at any place where Q-curves intersect and are all tangent, the P-curve which must meet there is also tangent to the Q-curves - see the points marked with t's in Figure 3. On the other hand, at intersections where the Q-curves intersect and no pair are tangent (such as M in Figure 2 or s in Figure 3), the corresponding P-curve is also tangent to none of the Q-curves, and indeed, its slope is the fixed point of a linear system whose iterates give the slopes of the Q-curves, where the iteration starts with the slope of the lowest-numbered Q-curve at the intersection.
|
Figure 1. Bifurcation diagram (through period 12). |
Figure 2. The first six Q-curves. |
Figure 3. Q and P-curve interactions. |
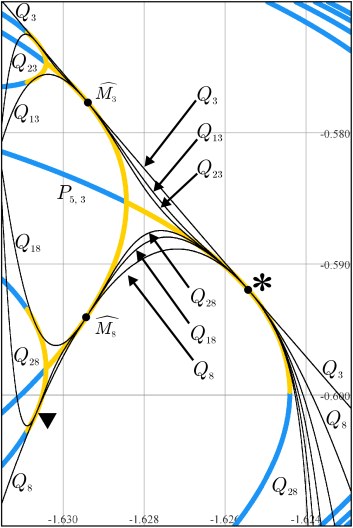
Figure 4. Q and P-curve interactions up close. |
There are actually infinitely many Q-curves
at any given intersection, so of course we only draw a few. Here's a "zoom" into figure 3
at the asterisk (*). The (*) is on a prime period 5 P-curve, which bifurcates into
a prime period 10 curve as you move left; another bifurcation from 10 to 20 occurs at the left edge of the picture. Attracting points
on the P-curves are in orange, repelling in blue.
The six lowest-numbered Q-curves which meet at (*) are drawn; note their subscripts differ by multiples of 5, and they are all tangent to the orange P-curve at (*). Moving left, notice how the Q-curves alternate going up or down to become tangent to the period 10 P-curve at M3 and M8 respectively, with subscripts differing by 10 now. This whole scenario is repeated (using the other Q curve families) in four other places above/below the (*) (see the dotted line in figure 3 above). In particular, the intersection involving Q5, Q10, Q15, ..., "happens" right above the (*), right on the c axis (figure 3). |
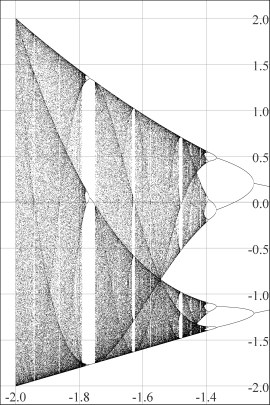
Figure 5. Orbit diagram. |
The family of functions fc(x) = x2 + c is sometimes referred to as Myrberg's map. Myrberg [1963] was the first to study properties of Q-curves (presumably without the aid of either orbit or bifurcation diagrams). In particular, he was interested in finding relationships among roots of Q-curves and accumulations points of these roots. Using Myrberg's results, Mira [1987] further studied these accumulation points and their relationships with intersecting families of Q-curves. The details of why Q-curves can be seen in the familar orbit diagram (Figure 5) are discussed in Neidinger and Annen [1996]; briefly, we see Q-curves in the orbit diagram because chaotic orbits (or at least, very long periodic orbits!) of 0 "pile up" more above than below Q-curves (or vice versa) and the abrupt difference in densities of points above versus below make the Q-curves visible. |
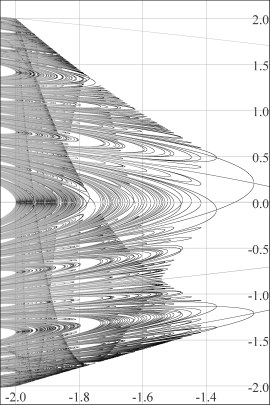
Figure 6. Bifurcation diagram (again). |
We see the Q-curves in the bifurcation diagram
(Figure 6) for a completely different reason: as the bifurcations
develop from c = 0.25 down to c = -2, the Q-curves are lined with more and more of those tangent intersections with P-curves. Just to the right of each such intersection, the P-curve turns around and exits left again. These "turn-arounds" make the Q-curves appear due to the "density difference" as there are more P-curves on the left
than on the right of the Q-curves.
Note that these tangent intersections are near but not at the tip of the involved P-curves: The tangent intesections occur to the left of any given bifurcation at the instant 0 becomes "superattracting"; for example at (*) and M3 and M8 in Figure 4 above...see Ross [2009] for details. |
References
Mira, C. [1987]
Chaotic Dynamics: From the One-Dimensional Endomorphism to the Two-Dimensional Diffeomorphism
World Scientific, Singapore, New Jersey, Hong Kong
Myrberg, P. J. [1958][1959][1963],
"Iteration der Reellen Polynome Zweiten Grades", I, II, III;
Annales Academiae Scientiarum Fennicae, Series A, 256, p.1-10,
268, p1-10, 336, p. 1-18.
Neidinger, R.~D. and Annen III, R.~J. [1996]
"The road to chaos is filled with polynomial curves"
American Mathematical Monthly, 103, 640-653.
Ross, C. and Sorensen, J. [2000]
"Will the real bifurcation diagram please stand up,"
College Mathematics Journal, 31, 2-14.
Ross, C., Odell, M., Cremer, S. [2009],
"The Shadow-Curves of the Orbit Diagram Permeate the Bifurcation Diagram, Too",
International Journal of Bifurcation and Chaos 19:9, 3017-3031.
|
Return to Chip's Home Page
|
© 2011 by Chip Ross Associate Professor of Mathematics Bates College Lewiston, ME 04240 |