|
|
|
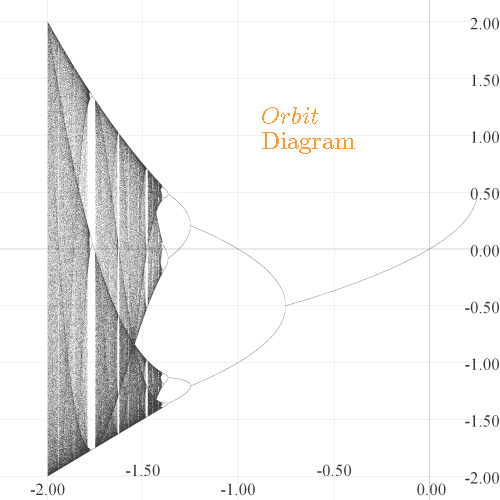
The algorithm for drawing the orbit diagram is described in many places, so we'll make it quick here, with the numbers actually used: at each of 4000 equally spaced values of c from left to right in [-2.25, 0.375], the first 2000 members of the orbit of zero for fc(x) = x2 + c were computed, and then the next 200 members actually plotted. It was expected that for c values at which there is an attracting periodic cycle, by 2000 iterations the orbit of zero should have become attracted; otherwise 200 scattered iterates indicate chaotic behavior. Therefore, chaotic "regions" and attracting periodic points appear. It took my program about 10 seconds to make the plot.
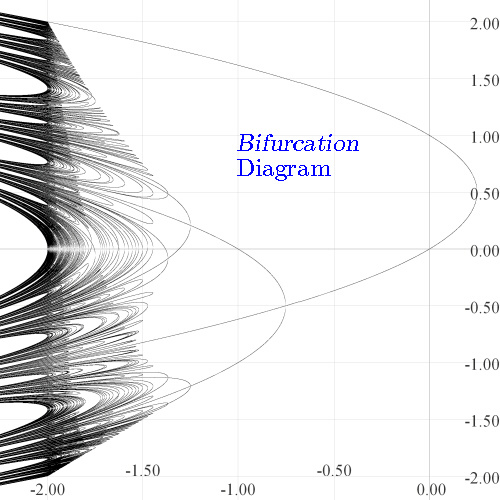
The algorithm for drawing the bifurcation algorithm is a little more complicated. It does not involve "backwards iteration" at all, but rather, relies on the intermediate value theorem. In the above plot, at each of 10,000 equally spaced values of c from left to right in the interval [-2.25, 0.375], a search was carried out for periodic points up to period 10 in the (vertical) interval [-2.2, 2.2]. At each c the search was carried out like this: The vertical interval [-2.2, 2.2] was itself divided into 10,000 subintervals. Let [a, b] be one such interval. If for some n, fcn(a)-a and fcn(b)-b had opposite signs, then fcn(p)-p=0 for some p in [a, b] by the intermediate value theorem. The point p has period n; the graphs of y=fcn and y=x crossed at p. The point (c,p) was then plotted. Such tiny vertical intervals are required because as c nears -2 and n nears 10, fcn has hundreds of local max/mins and can cross the line y=x many times in a small space and an even number of such crossings in an interval is not caught by our algorithm. As small as our intervals are, crossings still may have been missed, but we have found enough for an accurate picture. My program took about 88 seconds to plot this picture. The algorithm is detailed in our CMJ article.
Some parts of the two pictures are identical: namely at the periodic points which are attracting. The rest of the points in the bifurcation diagram show repelling periodic points. Notice how "dense" they are along the vertical line at c=-2! Note how they fall into "Cantor sets" on any vertical line to the left of -2! These observations are fully discussed in our CMJ article. Note that both curves are criss-crossed left-to-right by implicitly-drawn polynomial curves, called "Q-curves". They interact in a beautiful way with the bifurcation diagram, and this is the subject of a paper to appear.
It's easy to modify the algorithm to make other useful plots. Consider the examples below.
Coloring Periodic Points According To Period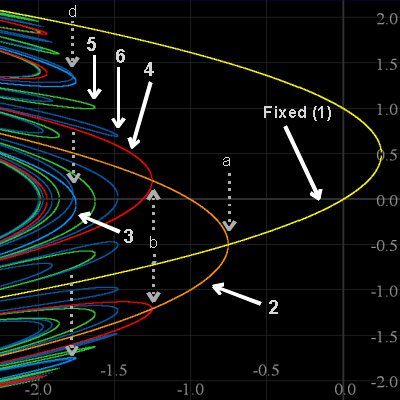
Click here to see related images on our "Period Page". |
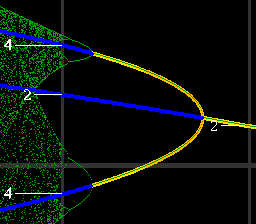
The image on the left shows periodic points of fc(x) = x2 + c colored according to their prime period.
We say a point p has prime period n if n is the smallest positive integer for which f n(p)=p.
All periodic points, repelling or attracting, up to prime period 6 are shown in this image.
There are three period-doubling bifurcations (PDBs) visible here: From prime period 1 to 2 (at a), from 2 to 4 (at b) and from 3 to 6 (at d). The remaining groups of periodic points all arise through saddle node (or tangent) bifurcations(SNBs). At a SNB, two new cycles of a given period are "born". There is one such group of period 1 cycles, "born" this way at c=0.25. There are no period 2 cycles appearing via SNBs. The SNB gives one group of period-3 cycles. There is one group of period 4 cycles born at -1.94 via the SNB. There are three groups of points of prime period 5, one of which is "born" directly under the "5" in the image (You'll see five greenish curves under the "5"; they comprise one group). And finally, of the six groups of points of period 6, five of them arise through the SNB; one of them is born directly under the "6" (Six dark blue curves there comprise one group). All these curves of periodic points cross the vertical line c=-2. This illustrates that f-2(x) = x2 - 2 has the maximum possible number of points of any given prime period n: 2 fixed points, 2 period-2, 6 period-3, 12 period-4 (8 via SNB and 4 by PDB), 30 period-5, and 54 (48 by SNB and 6 by PDB) period-6. Note the degree of f-26 - x is 64. Points of prime periods 1, 2 and 3 also "masquerade" as period 6. So the total number of (not necessarily prime) period 6 points is 64: 2+2+6+54=64. Indeed, it seems that for c < -2, fc(x) = x2 + c has the maximum number of points of any prime period n, and they're all repelling. |
Coloring Periodic Points According To Slope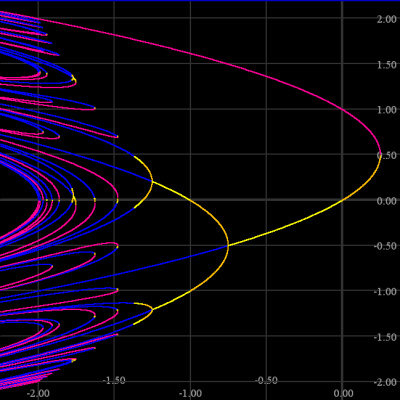
Click here to see related images on our "Slopes Page". |
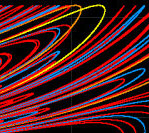
The image on the left shows periodic points of fc(x) = x2 + c colored according to the slope of fcn(p), where p is a point of prime period n for fc. Here n ranges from 1 through 6.
If that slope of fcn(p) is between -1 and 1, then the point p is on an attracting cycle; orbits of points near p will converge to the orbit of p. Such points are colored yellow (slopes from -1 to 0) or orange (0 to +1) in the image. On the other hand, if the slope of fcn(p) is less than -1 or greater than +1, the point p is on a repelling cycle. Around such a point is an interval S such that given any point q in the interval (save for p itself), the orbit q fcn(q), fc2n(q), fc3n(q),..., eventually contains a value no longer in the interval S. Repelling periodic points are colored blue if the slope of fcn(p) is less than -1 and fuschia if it's greater than +1. The orbit and bifurcation diagrams "agree" at the attracting points; the next section of this page illustrates this by superimposing the orbit diagram on the bifurcation diagram. Theoretically, at each period doubling bifurcation and each saddle node bifurcation there is always a new attracting cycle "born". Such cycles become repelling as c continues to decrease, and as c nears -2, the changeover happens in a very short time. Indeed, you don't see many attracting points below c=-1.5. Some zooms will show them; see the related images on our "Slopes Page". |
Click here to see the whole figure and more on our Superposition Page. |
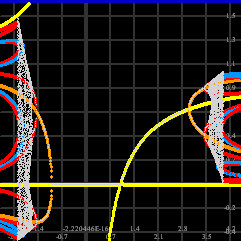
The image on the left shows both the bifurcation and orbit diagrams together on the same plot. Periodic points on the bifurcation diagram were colored as in the figure above, so fuschia and blue represent repelling points,
and yellow and orange show attracting points. The bifurcation diagram was plotted using thick dots.
The orbit diagram was plotted in green. At attracting periodic points, it "agrees" with the bifurcation diagram. This agreement is seen as the thin green lines centered in the yellow and orange curves. Click here to see the big picture of which this is a little piece. |
Click here to see something you might not expect. |
The logistic function is often used to model population growth, so negative values aren't usually discussed. But there's a bifurcation diagram and an orbit diagram on each side of the vertical axis. And something else you might not have seen, in addition to a "transcritical" bifurcation. Check it out. |
|
You might see csin(x) discussed in places. But sin(cx) is very interesting in that it sports "pitchfork" bifurcations, and not only in f, but in its iterates. The bifurcation diagrams help us see this. Two attracting cycles at various c values means for "broken" orbit diagrams. We can fix them. |
|
Return to Chip's Home Page
|
© 2004 by Chip Ross Associate Professor of Mathematics Bates College Lewiston, ME 04240 |