|
|
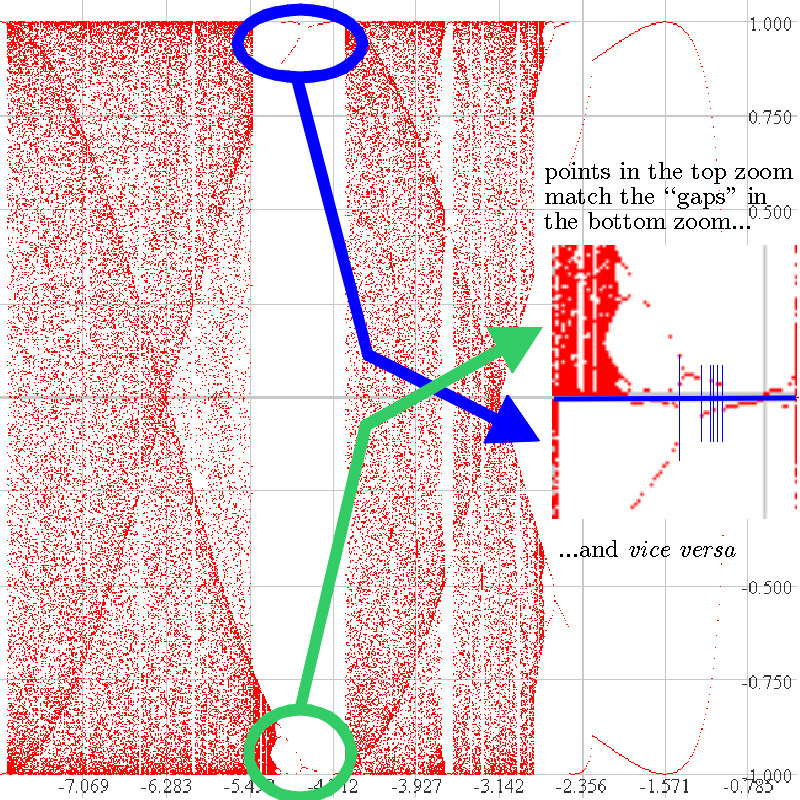
We have plotted an orbit diagram following the orbit of 0.17. The circled regions show two "broken" orbit diagrams. Here's what happened: for some c values, the orbit of 0.17 was attracted to the attracting cycles along the top part of the picture, and for others, attracting cycles near the bottom. This function has a negative Schwarzian derivative, and no unbounded intervals can be attracted to a single cycle. So each attracting cycle must attract a critical point. Here the critical points change as c does (unlike for, say the logistic function, which has 0.5 as a critical number for all values of c). But our Orbits program can plot the orbits of critical points which are given as functions of c. The next picture shows what happens when we follow orbits of these "moving" critical points. |
|
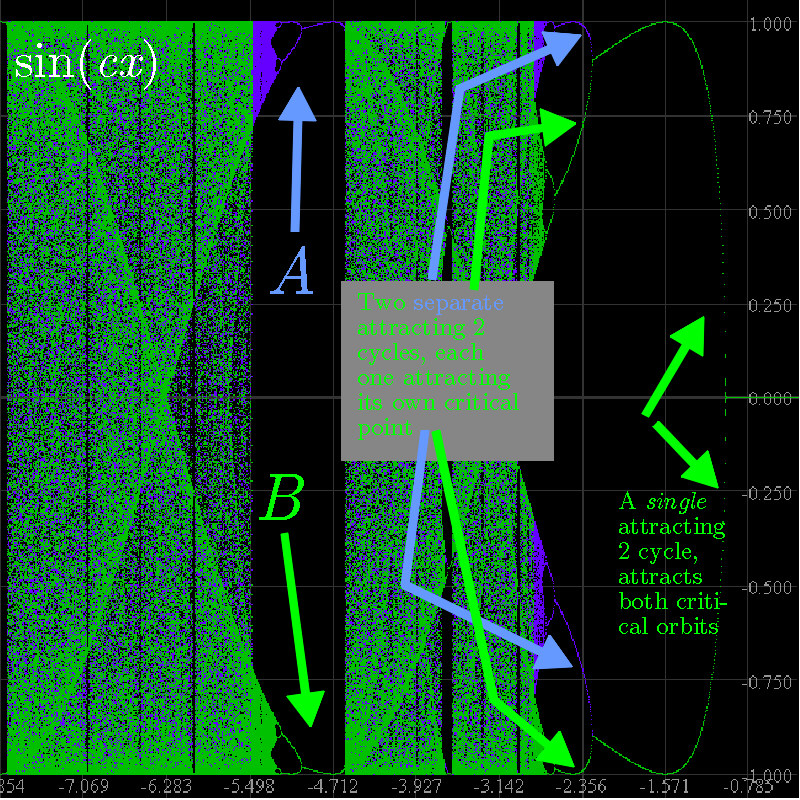
In this orbit diagram, we have followed the orbits of two different critical points in two separate passes. First, pi/(2c) in blue, and then 3pi/(2c) in green. Note how the two "copies of the usual orbit diagram" marked "A" and "B" are "complete" now, each representing the usual period 1,2,4,8... period doubling scenario.
On the right side of the figure, the attracting 2-cycle attracts both critical points; since we plotted the blue one first it's covered by the green one. But now notice that at the pitchfork bifurcation two attracting 2-cycles are "born", one attracting pi/(2c) and the other, 3pi/(2c). It looks like period-doubling, but that would have produced a single attracting 4-cycle. Note how both critical numbers "go chaotic" at the same c values and appear to spread their values over the same vertical regions. |
|
Return to Chip's Home Page
Return to Bifurcation and Orbit Diagrams page (two levels up) Return to part one of the sine(cx) page (one level up) |
© 2004 by Chip Ross Associate Professor of Mathematics Bates College Lewiston, ME 04240 |