|
|
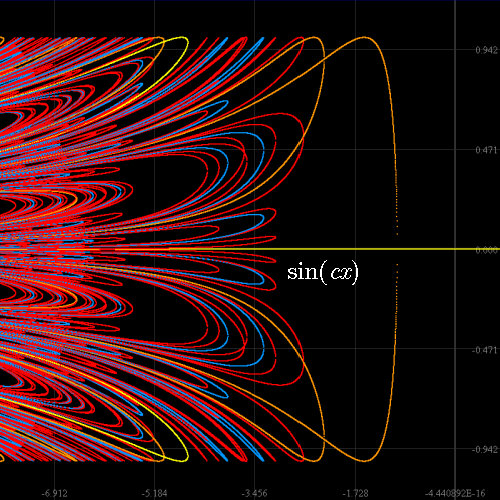
Periodic points really pile up as c descends through negative values. Here we are only plotting points of period 4 or less! Points are colored by period; look below for a zoom with periods labeled. |
|
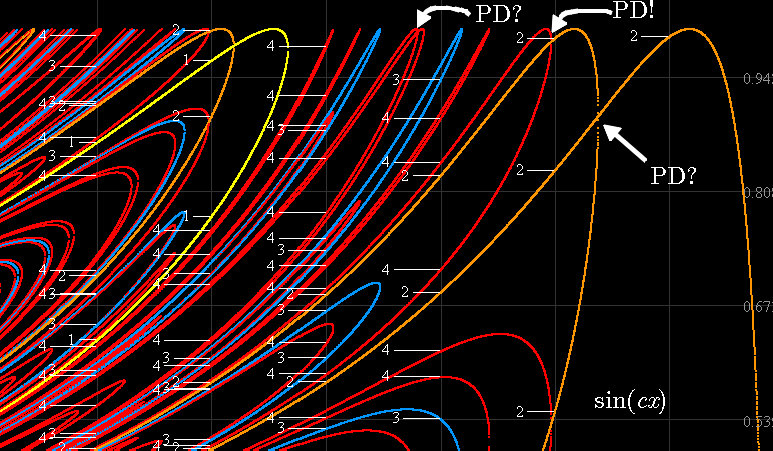
Points labeled and colored by period. There are some places marked "PD?" that at first glance look like standard period doubling bifurcations, but in fact are "pitchfork" bifurcations.
On the period 2 cycle, at "PD?" marked by the straight arrow, as c descends through about -2.25, a single attracting two cycle becomes repelling, but two new attracting cycles of the same period are born. At a period doubling bifurcation, we would expect instead a single new attracting cycle of twice the period. As c continues to descend, these two 2-cycles each undergo period doubling, at the same c value. (Marked "PD!".) |
|
With two attracting cycles at some c values, an orbit diagram made by following the orbit of a single point cannot show both, and points picked to plot the orbits might "jump" from one curve to the other as c changes, producing a "broken" appearance in the orbit diagram. Visit this page for an explanation. |
|
Return to Chip's Home Page
Return to Bifurcation and Orbit Diagrams page (one level up) |
© 2004 by Chip Ross Associate Professor of Mathematics Bates College Lewiston, ME 04240 |