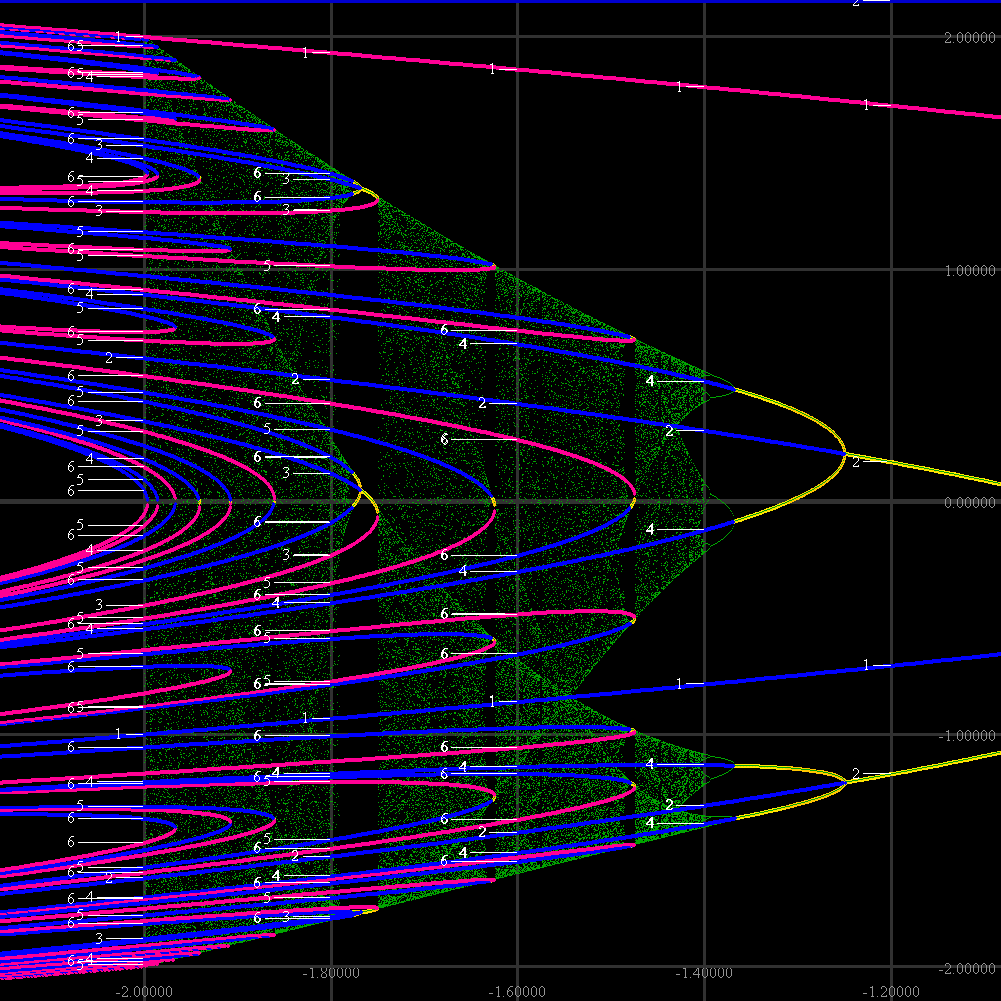
The orbit diagram was plotted in green. At attracting periodic points, it "agrees" with the bifurcation diagram. This agreement is seen as the thin green lines centered in the yellow and orange curves.
We've used our program's automatic period labeling feature to indicate the periods of the points on the bifurcation
diagram. Labels are created when curves of periodic points cross the "gridlines". Curves are not labeled whenever a new label would partially cover one of the same number below it. Other curves are labeled more than they need to be.

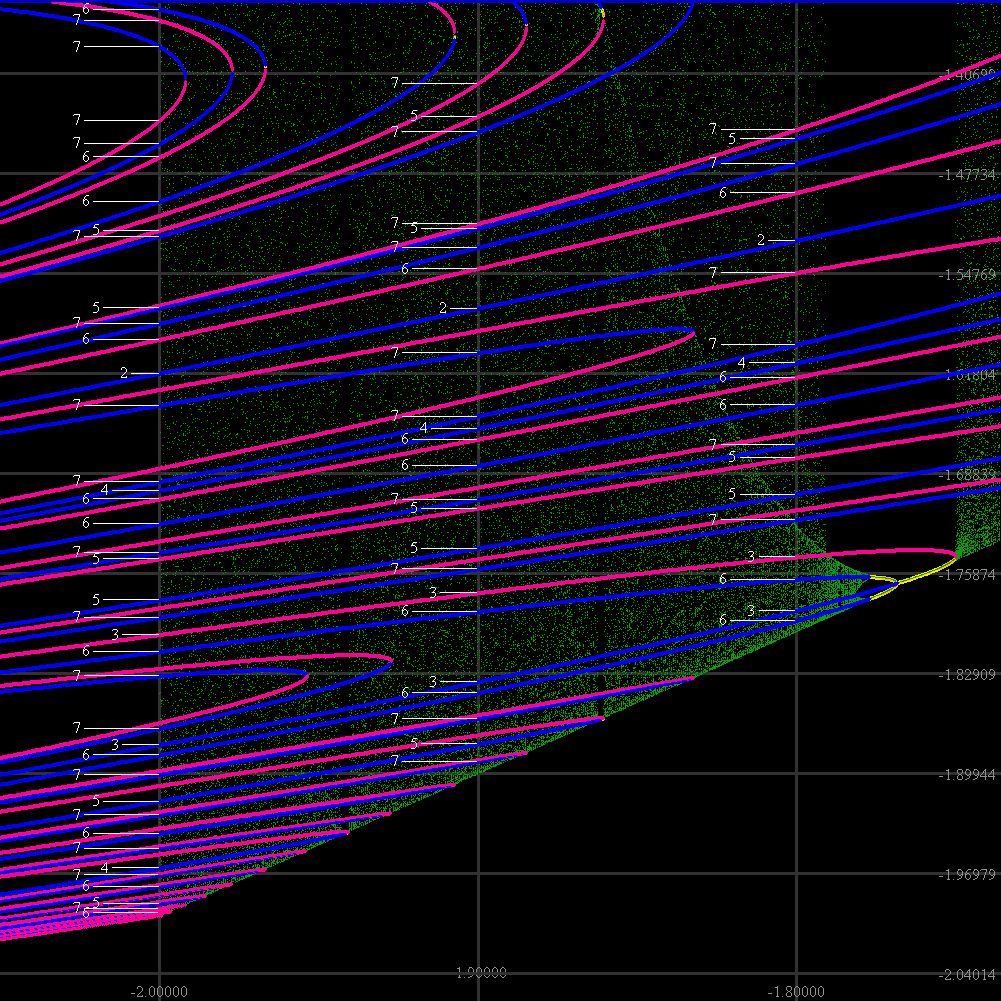
In the above image, things are pretty crowded in the lower left. Below is a zoom, with points of period 7 added. Adding points of period 8 again crowds the picture too much. Note you can't see a lot of attracting periodic points.
There is a good sized interval of them at the 3 to 6 period doubling, lower right.

|
Return to Chip's Home Page
Return to Bifurcation and Orbit Diagrams page (one level up) |
© 2004 by Chip Ross Associate Professor of Mathematics Bates College Lewiston, ME 04240 |