|
|
|
|
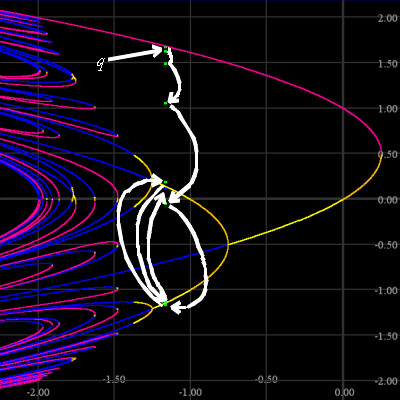
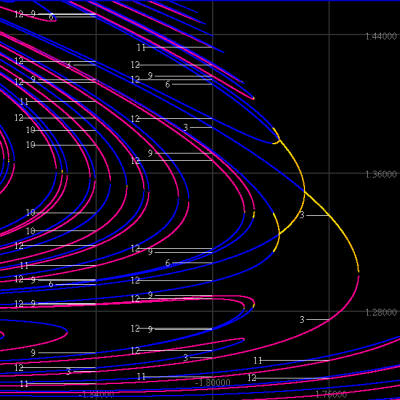
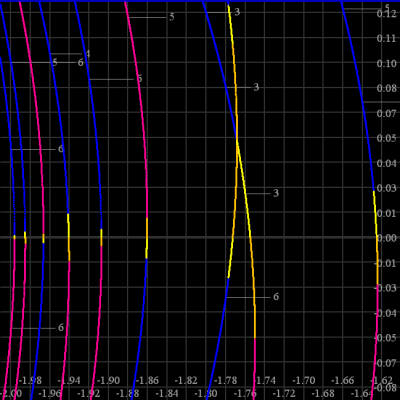
| This is the same image as on the previous page, with the orbit of one point q plotted and followed with hand-drawn arrows. The orbit of q starts near a repelling fixed point, moves away with a few ever-increasing leaps, and eventually is attracted to a 2-cycle. Here, c is roughly -1.68. | Above, we've "zoomed in" to the upper left-hand quarter of the first picture in hopes that we'll see the attracting periodic points at the rightmost tips of the curves of periodic points. Even though our search was carried out at c values spaced apart by only 0.00002, we don't see many! The "intervals of attraction" are very small indeed! In this image we've used our program's automatic period labeling feature. The picture is populated mostly by curves of periods 9, 10, 11, and 12, although we asked for points of any periods from 1 to 12. | In this image we've only asked for points up to period 6. This zoom is centered around the c axis near the 3-to-6 PDB. To get the attracting points on first six curves to show up required searching c values with an increment of about 0.000005! So again, the "intervals of attraction" are very small. |
|
Return to Chip's Home Page
Return to Bifurcation and Orbit Diagrams page (one level up) |
© 2004 by Chip Ross Associate Professor of Mathematics Bates College Lewiston, ME 04240 |