|
|
|
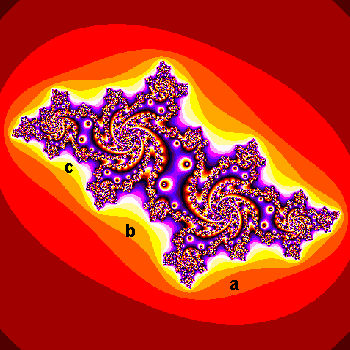
Points in the orange region outside have orbits which
move away, "out to infinity". In this figure, the point a
is in the orange. a is sent to b (ie,
f(a)=b),
then b goes
to c, and so on. Note that all the points in this
orbit are in the orange, and they dance around, getting further away
and then they're gone. We say the orbit of a "escapes
to infinity".
The Julia set itself is the boundary that separates the black from the orange regions. The orbit of any point on that boundary stays on it forever (although it's impossible to show this with computer programs since the exact coordinates of points on the boundary can't be stored --- to do so would require that the computer could store any and all numbers with "infinite precision"). Our computer program plots these orbits one point at a time dynamically; it's a fun and very educational process. Even more exciting is that as each point a, b, c... of the orbit is plotted, we can simultaneously play a tone whose pitch is dependent on the coordinates of the point, and in this way your ears can help you hear the periodicity of the attracting cycle as it is approached. |
|
Now, it's customary to color points in the plane according to
how many iterates must be calculated before the long-term
behavior of the points' orbits are determined.
Members of any given orbit will
eventually either (1)
become big
enough to indicate the orbit is "escaping to infinity", or
(2) pass close enough
to one of the members of the attractive 5-cycle to indicate the orbit
is becoming attracted to it.
In the following picture, it so happened that the orbits of all points in the orange region a all passed the "escape to infinity" test after just three members of their orbits were computed; all points in the region b took four iterations, and the points in the yellow region c took five iterations and so on. These colored bands are called level sets. The two "bullseyes" you see in the middle of the image surround points whose orbits very quickly became attracted to the 5-cycle. One of them surrounds the point B on the 5-cycle in figure 1, the other surrounds one of the two "preimages" of B; that is, it's a point B* satisfying f(B*)=B. (The other preimage of B is the point A on the 5-cycle). Again the bands of colors are called level sets. |
|
|
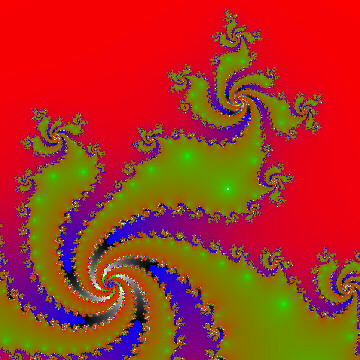
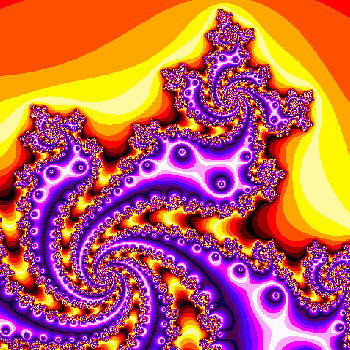
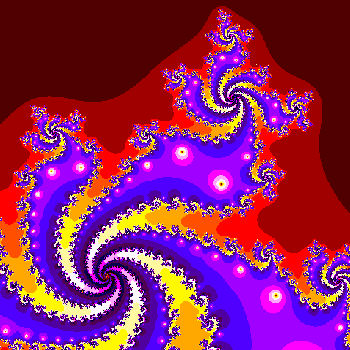
| The image above shows a zoom into our Julia set, and also displays a different coloring scheme: The red/yellow colors are reserved for the points whose orbits escape to infinity, and the blue/purple colors show points whose orbits become attracted to the 5-cycle. (Since we are using only 16 colors here, they must be "recycled" --- for example, points in yellow represent points whose orbits which escape at different numbers of iterations) | This image shows the same portion of the Julia set as the one on the left, but the colors are changed according to the square root of the level set: Points which "escape" to infinity after 36-48 iterations get one color ("color number 6"), then 49-63 get color #7, 64--80 get color #8 and so on. |