Introduction to the DOS program, "Orbits"
Where to put "orbits"
 Once you've downloaded it, we recommend putting the "orbits" program in a directory with a
short name, eg: C:\temp. Avoid pathnames where any part of the
path has more than 8 characters, otherwise, "orbits" will
experience a runtime error!
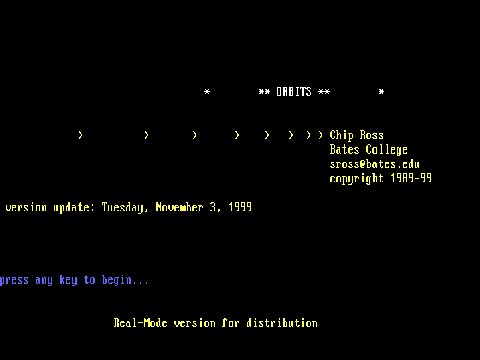
When you click on "orbits.exe" from Windows Explorer,
it should open in a DOS window and run. You should see the opening
screen, shown to the right:
(Note the actual "current version" is: Wednesday, February 2, 2000)
Orbits: Main Screen
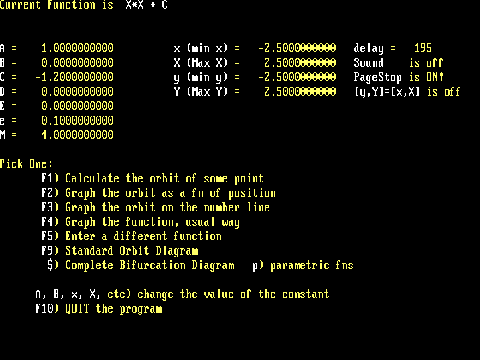
 After pressing a key, the "MAIN SCREEN", shown here, appears.
We discuss the different commands below; they appear in white on the main
screen. For example, "C", F1, and "S" (the first letter of Sounds) are all commands.
(In this document, we surround command letters with double-quotes ("),
but you will NOT use the double-quotes when actually running the program;
you just press the indicated letter.
One ESSENTIAL thing to remember
about "orbits" is that ALL commands are case-sensitive. "X" and "x" mean different things, for example.
Also, you can stop orbits from whatever it's doing at any time, by pressing "q" (for "quit")
Orbits: Current Function
 The "Current Function" is X*X+C. This can be changed (see F5, described below). It is the function the program will use in computing iterations, bifurcation diagrams, etc.
Just leave it alone for now, since our examples below will use X*X+C.
Orbits: Constants List
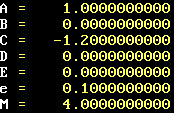
 A list of constants used by "orbits": A, B, C, D and E are constants
that can be built into the Current Function. Since C is set to -1.2, "orbits" is computing values for the function X*X-1.2.
To change the value of one of these constants, type the letter of the
constant. You will be prompted for its new value. Try changing
C to, say, -1.55. (Press "C", then -1.55 (Enter))
You can enter numbers from formulas by prefacing
them with a "#" sign: For example, #(sqrt(5)-pi)/exp(1) (Enter)
sets C to -0.3331239118.
Orbits: Graphics Windows Ranges
 Parts of the program draw a graph in the plane. Here,
x and X represent the values at the
left and right edges of the graphs, and y and Y represent the
values at the bottom and top. NOTE WELL: (a source of confusion)
these values are just for setting up the windows. When orbit/bifurcation diagrams are actually plotted, the horizontal
axis will REPRESENT a range of C values, and the vertical axis,
a range of x values. (But these ranges are still SET by
the values shown here: [x,X]=horizontal range; [y,Y]=vertical range...
When the program opens, both ranges are set to
[-2.5, 2.5].
Orbits: Primary Commands
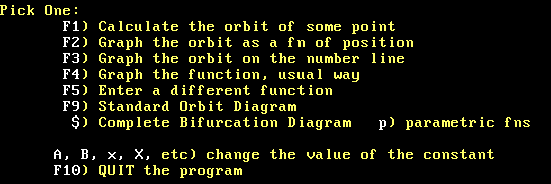
 To the left are shown the primary commands of the "orbits" program.
We will describe them in detail below.
-
Press F1 to calculate the orbit of a point under the Current Function.
You will be prompted for the initial point of the orbit; to use the initial point suggested,
just press Enter, otherwise type in a new number [decimals only] and press enter.
The first 20 members of the orbit will be calculated. To see more, press the spacebar. To make the list go faster, press "f" a couple times. Press "s" to slow it down.
When you have seen enough, press "q".
- Press F2 to see the members of the orbit plotted as a function of
their positions in the orbit. Press the spacebar to STOP the plot; each subsequent press of the spacebar will plot the next member of the orbit AND list it numerically at the bottom of the screen. When the plot reaches the right side of the screen, it will erase and begin again from the left. To keep the plot going, press "c". "f" and "s" make the plots go faster or slower, repsectively.
Press "q" to retrun to the Main Screen.
- Press F3 to see the members of the orbit plotted on a number line. A big "X" is plotted for each new member of the orbit; the "X"'s shrink in size to little dots to give a "history" of where the orbit has been. Commands "f", "s", "q", "c", and spacebar are as in F2.
- F4 plots the graph of the Current Function in the usual way. To graphically find fixed points, the line y=x is also plotted.
You can move a rudimentary cursor up and down the line y=x to help identify
crossings of the Current Function and y=x. To move the cursor,
press "u" or "d" (for up and down). The cursor moves a pixel at a time. Use "U" and "D" to move it 10 pixels at a time. The cursor's location is given at the top left of the screen. To see a higher iterate of the Current Function, press "N"; "n" selects a lower one,
BUT YOU have to press "p" to actually plot the new iterate. "C" clears the screen. You can ZOOM into where the cursor is by pressing "M" (for Magnify); press "m" to climb back out of a zoom. The mean slope of the
function from where it enters to where it exits the screen is given;
this is useful for determining the attracting/repelling nature of
any periodic points. "q" brings you back to the main screen. (This
part of "orbits" was used by our students to collect data for Figure 4 of the CMJ article).
- F5 is used to enter a new function. Use fairly standard notation,
more or less as used by Maple. Always use X (capital X) for the variable. Here
are some examples:
- C*X*(1-X)
- sin(C*X)
- X^3*(C+sqrt(X))
- exp(C*X)
- Xv3 [use AvB for the Bth root of A]
Press Enter when you've typed in your function. If "orbits" finds an error, it will try to point it out, otherwise, press Enter again and you will be returned to the Main Screen, and the function you've entered will appear as the Current Function.
- F9 is used for plotting orbit diagrams. Since these can also be plotted
from within the next part of the program, we'll skip to that NOW:
- "$" plots both
bifurcation and orbit diagrams
. We'll devote a separate
page to this; click here for a complete description. NOTE WELL: In this part of the program, "q" stops a plot in progress;
then to get back to the Main Screen, press F10.
 Once you've downloaded it, we recommend putting the "orbits" program in a directory with a
short name, eg: C:\temp. Avoid pathnames where any part of the
path has more than 8 characters, otherwise, "orbits" will
experience a runtime error!
When you click on "orbits.exe" from Windows Explorer,
it should open in a DOS window and run. You should see the opening
screen, shown to the right:
 After pressing a key, the "MAIN SCREEN", shown here, appears.
We discuss the different commands below; they appear in white on the main
screen. For example, "C", F1, and "S" (the first letter of Sounds) are all commands.
(In this document, we surround command letters with double-quotes ("),
but you will NOT use the double-quotes when actually running the program;
you just press the indicated letter.
![]() The "Current Function" is X*X+C. This can be changed (see F5, described below). It is the function the program will use in computing iterations, bifurcation diagrams, etc.
Just leave it alone for now, since our examples below will use X*X+C.
The "Current Function" is X*X+C. This can be changed (see F5, described below). It is the function the program will use in computing iterations, bifurcation diagrams, etc.
Just leave it alone for now, since our examples below will use X*X+C.
 A list of constants used by "orbits": A, B, C, D and E are constants
that can be built into the Current Function. Since C is set to -1.2, "orbits" is computing values for the function X*X-1.2.
 Parts of the program draw a graph in the plane. Here,
x and X represent the values at the
left and right edges of the graphs, and y and Y represent the
values at the bottom and top. NOTE WELL: (a source of confusion)
these values are just for setting up the windows. When orbit/bifurcation diagrams are actually plotted, the horizontal
axis will REPRESENT a range of C values, and the vertical axis,
a range of x values. (But these ranges are still SET by
the values shown here: [x,X]=horizontal range; [y,Y]=vertical range...
When the program opens, both ranges are set to
[-2.5, 2.5].
 To the left are shown the primary commands of the "orbits" program.
We will describe them in detail below.