

|

|
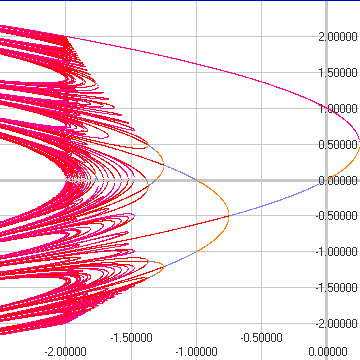
On the left is the bifurcation diagram. It shows for each C value on the horizontal axis, the locations on the vertical axis of any points of periods 1 through 8. For a fixed C value, points of period N are found by scanning the (vertical) interval [-2.5,2.5] for crossings of the line y=x and the f'n f_C(x)=x^2+C composed with itself N times --- this algorithm is detailed in our paper. The slope of (f_C)^N at such a crossing determines if the point is on an attracting or repelling cycle. The above bifurcation diagram is colored according to these slopes:
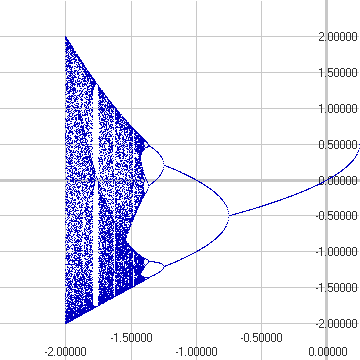
The two diagrams coincide at C values for which there is a attracting periodic cycle; again such points appear orange and blue in the bifurcation diagram
Details The above pictures were drawn with my Windows version of "orbits", saved to bitmap files, and subsequently compressed using Microsoft's "Picture It" photo editing program.
|
Return to Chip's Home Page
Return to CMJ Article Page |
© 2001 by Chip Ross Associate Professor of Mathematics Bates College Lewiston, ME 04240 |