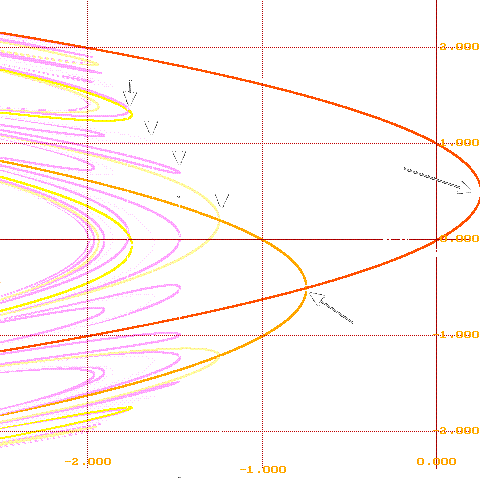
 Our second image shows only the (Complete) Bifurcation Diagram,
and then again
only for points of periods 6 or less. Points of the same
color represent points of the same prime period.

In a short-term course at Bates, we produced an algorithm that
shows the locations of all attracting and repelling points
for each c value, and the resulting picture is called the
"(Complete) Bifurcation Diagram". You can see part of it
represented by the square dots in the figure. By "part of it",
we mean we asked the computer to only show points of period 6 or less,
since the higher the period, the more crowded the picture becomes.
In the next figure, we will explain what the colors mean.
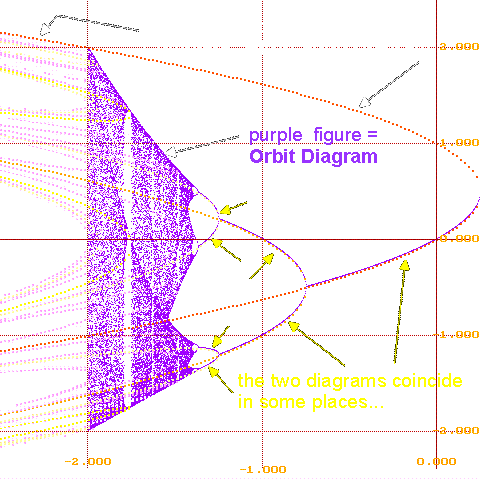
Even if you are unfamiliar with the terms "attracting" and "repelling
cycles", you can still see that the two diagrams present
quite different types of information. The two diagrams coincide whenever
the orbit diagram shows an attracting cycle; where they don't coincide
the bifurcation diagram shows repelling cycles. In some sense then,
there are "a lot more" repelling points than there are attracting ones.
 Our second image shows only the (Complete) Bifurcation Diagram,
and then again
only for points of periods 6 or less. Points of the same
color represent points of the same prime period.
Details: Point A results from a "tangent bifurcation" in f(x)=x^2+c; two fixed points are born as c passes below (moves to the left of) 0.25. The upper fixed points are repelling. The the lower ones are attracting, until at B, where a period-doubling bifurcation occurs. Then the fixed points become repelling and an attracting 2-cycle is born. As c continues to decrease, at C another period doubling occurs: An attracting 4-cycle is born, while the 2-cycle becomes repelling.
Point D represents a period doubling bifurcation also, as points on an attracting 3-cycle (in yellow) become repelling as an attracting 6-cycle is born.
Point E shows the birth of a pair of 6-cycles, as the sixth
iterate of f undergoes a tangent bifurcation;
similarly, point F shows the birth of a pair of 5 cycles.
|
Return to Chip's Home Page
Return to CMJ Article Page |
© 2001 by Chip Ross Associate Professor of Mathematics Bates College Lewiston, ME 04240 |