Simultaneous Trapping of Rb and Cs in a Vapor-Cell MOT
Amy C. Sullivan and George A. Ruff
Department of Physics, Bates
College
Lewiston, ME 04240
Abstract
We have developed a magneto-optical trapping apparatus which permits simultaneous cooling
and trapping of cesium and rubidium in a compact octagonal vapor cell. The background vapor
pressures of each atomic species are independently controllable, as are the intensities and
frequencies of the respective trapping and repump lasers. Trap sizes and positions are
determined by a pair of CCD cameras which view the trap from orthogonal directions, and
loading times for each species are determined by PMT observations of trap
fluorescence.
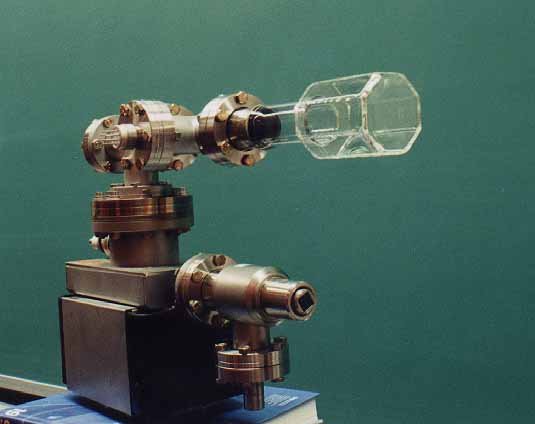
The Vapor Cell
The vapor cell is made from pyrex glass plates, fused together at the edges. The atomic
vapors are generated by getters mounted in the sidearm of a conflat tee. The vapor pressure of
each species is controlled by adjusting the current in the corresponding getter.
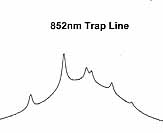
Saturated Absorption Spectra

Two weak probe beams are sent through a cesium cell into a pair of photodiodes. A strong,
counter-propagating pump beam overlaps one of the weaker probe beams. This pump beam
causes Lamb dips in the Doppler curve of the weaker beam. When the two photodiode signals
are subtracted, the background Doppler curve disappears, revealing the hyperfine structure as
seen above. The repump line shows the 6S1/2(F=3) 6P3/2(F'=2,3,4) transitions while the
trapping line shows the 6S1/2(F=4) 6P3/2(F'=3,4,5) transitions of cesium. The trap line is
locked slightly to the red of the F = 4, F' = 5 transition. The frequency of the repump laser is not
as critical and can be locked either to the F = 3, F' = 3 or to the F=3, F' = 4 transition.(1) By
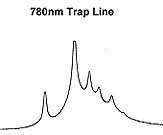
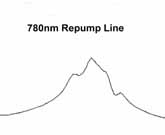
using saturated absorption spectroscopy as described for Cs, the hyperfine structure of 87Rb is
shown. The above repump line shows the 2S1/2(F=1) 2P3/2(F'=0,1,2) transitions and the
trapping line shows the 2S1/2(F=2) 2P3/2(F'=1,2,3) transitions. Here the trap laser is locked
slightly to the red of the F = 2, F' = 3 transition and the repump is again not as critical, but is
locked to the F=1, F' = 2 transition.(2)
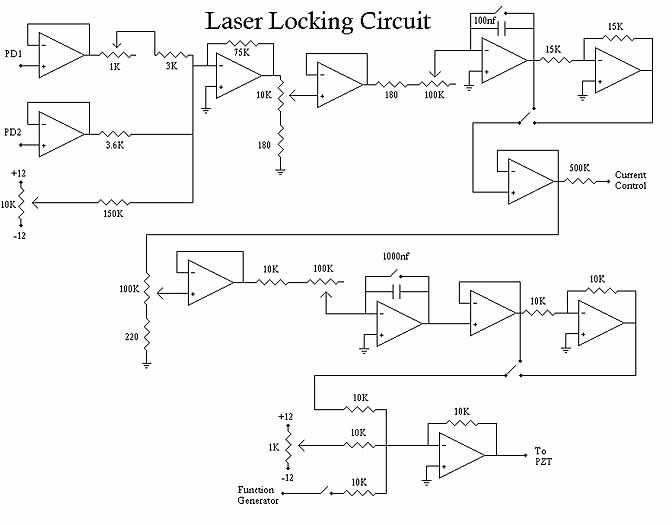
The Locking Electronics
The two inputs to this locking circuit come from the photodiodes in the saturated
absorption setup. One signal is negative and the other is positive. They are added to show
the hyperfine structure of the atom. The circuit is used in two ways to lock the laser
frequency to the desired atomic transition. The output of the first integrator goes directly
to the current input of the laser controller. This is used for rapid adjustments in the laser
frequency. The output of the first integrator is then integrated again. The second integrator
attempts to lock the laser current to its initial set point. The output of this second integrator
goes to a PZT which controls the diffraction grating thereby altering the length of the
external laser cavity. These two outputs keep the laser locked to the atomic transition
needed to see a trap.(3)
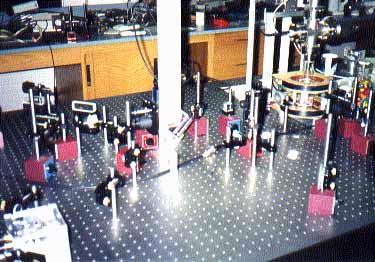
Optical Table
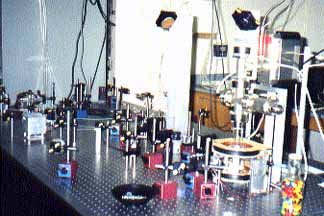
Another View
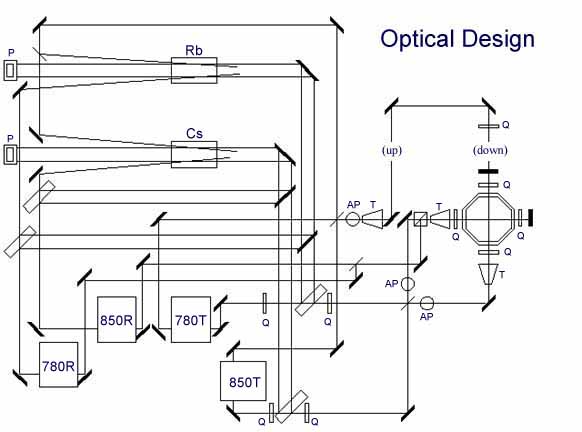
Optical Schematic
Each saturated absorption cell is used to lock a trap laser and a repump laser. The lasers each
contain an internal beamsplitter, producing two output beams. The output beams from all
four lasers are combined before entering the trap cell. Thick glass plates are used to pick off
probe beams for saturated absorption spectroscopy. The trap beams are then combined using
nonpolarizing beamsplitters to preserve the horizontal polarization of the trapping beams. These
elliptical beams are then sent through anamorphic prisms to stretch the beams horizontally so
that the resulting beams are circular. These are broadened by 4X telescopes and sent through
quarter wave plates to make the beams circularly polarized. The shape and polarization of the
repump beams are less important, and these beams are sent into the trap cell on only one axis.
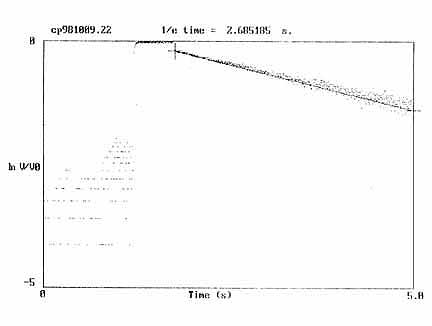
Fill time (logarithmic curve)
When one of the trapping laser beams going to the trap is blocked, the trap disappears. After
unblocking this beam, the trap slowly reforms. This experiment is performed with the Cesium
trap, the fluorescence from which is detected by a PMT. The above graph shows the log of this
exponential growth, with the 1/e trap fill time as calculated from the slope of the line. The
background pressure for this trap was relatively low, resulting in a slow fill time of 2.68s.
References
1. Christopher Roy Monroe, Ph.D thesis, University of Colorado (1992).
2. C. Wieman, G. Flowers, and S. Gilbert, AJP, 63, 317-330 (1995).
3. G. D. Rovera, G. Santarelli, and A. Clairon, Rev. Sci. Intrum., 65, 1502-
1505 (1994).
