SPSS is a powerful and commonly used statistical software for the social sciences. The purpose of this website is to provide an easy reference for common SPSS questions and techniques. Since more and more students are getting data from Qualtrics, many of these tips focus on using data from Qualtrics. (For more Qualtrics help, please see my documentation on Qualtrics Help for Psychology Majors.)
Note: My goal in the videos is to be clear and thorough, but also as efficient as possible, out of respect for your time. If you find that I am clicking through menus too quickly, I encourage you to use youtube's features to replay certain segments or to slow down the playback speed.
This documentation is broken down into several major sections. Follow the links below to learn about different topics, or scroll down the page to read them all!
This page is part of the Technical Resources for Students section of the Bates College Psychology Department website.
SPSS file basics
Bates virtual environment (VPN)
Creating independent variables
Creating an IV from randomized blocks
Creating an IV from an embedded data object
Creating an IV using median split
Creating dependent variables
Creating a DV from randomized blocks
Merging variables into subscales
Using SPSS Syntax
SPSS file basics
Bates virtual environment (VPN)
You can access SPSS in the Bates Virtual Private Network (VPN) from any browser by clicking here.
Exporting data from Qualtrics
Once you have collected data in Qualtrics, you can export the results in various formats, including into an SPSS .sav file. To do this, click on the "Data & Analysis" tab at the top of your survey. On the right side of your browser, there is a button labeled "Export & Import". Click this button and choose "Export Data".
- At the top of the dialog, choose SPSS.
- In the bottom left, click "More Options"
- Scroll down and uncheck the box labeled "Compress data as .zip file"
- If you have any sort of randomization or counter-balancing in your survey, you can check the checkbox under "Export viewing order data for randomized surveys" to include a variable in SPSS that will show which randomized conditions each participant was assigned to.
- Finally, click the green Download button.
A file notification will appear in your browser when the file download is complete. You can click on this notification to open the SPSS file.
Qualtrics also supports exporting to Microsoft Excel. I have had better luck exporting to Excel using the CSV (comma separated values) format instead of the Excel format in their exporter.
Variable formats
Most question types in Qualtrics will be exported to SPSS as a single variable. However, there are a few important exceptions in which a single Qualtrics question will result in more than one SPSS variable being created. The two most commonly used ones in social science research are the Matrix Table and the Multiple Choice: Choose Many question types. For those, each item (or statement) in the question is exported to SPSS as its own variable. The Qualtrics variable name will be appended with an underscore and numbers for each item.
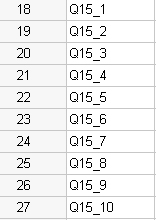
In the example pictured below, "Q15" is a Matrix Table with 10 statements. In this screenshot from the variable view in SPSS, we see that each statement has been given a unique variable name in SPSS.
In the case of a Multiple Choice: Choose Many question type, each checkbox will be given its own variable in SPSS. If a participant checks a box, they will be given a value of 1 for that variable. If they don't, it will be left blank. In the example below, there was a Multiple Choice: Choose Many question type called "wild_animal" with 8 different checkboxes. This screenshot from the data view in SPSS shows how the data were imported using 1s and blanks depending on which boxes the participants checked.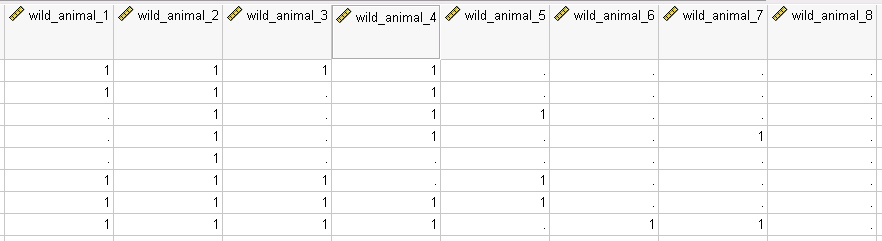
Variable names
As we saw in the examples above, Qualtrics will export the question names as variable names in SPSS. The text of the question is used as the variable label. In the previous example "Q15" used the Qualtrics default variable name while "wild_animal" was renamed in Qualtrics before being exported.The Qualtrics naming convention works pretty well (Q1, Q2, Q3, etc.), but there are times when this gets a little cumbersome in SPSS, especially if you have a long survey with lots of questions.
I recommend changing important question names in Qualtrics before exporting to make them easier to keep track of in SPSS. While it makes the most sense to do this as you are creating your survey, you can rename questions at any point in the process, including after your data are collected. Just export the data again after renaming questions and the new question names will be used in the export process.
Where to save your data files
It's easy to get in the bad habit of saving your files on the desktop or the Documents folder of the computer you are working on. However, when you are using a Bates computer to access SPSS, doing this can result in temporary or permanent data loss! Instead you should save your work to the Paris server that Bates gives all faculty, staff, and students access to. On Paris, each of us has a dedicated folder, password-protected using your Bates network ID, that can be accessed from anywhere on the network. That means:
- You aren't limited to using a specific computer where your work is saved.
- Your work is backed up in case the computer you were working on gets reimaged or removed.
- All of your projects' data files are in the same location all the time.
Check out the video below for tips on saving to Paris from within SPSS.
Creating independent variables
Between vs. within
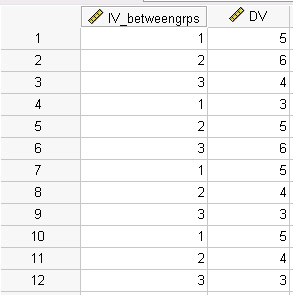
There are two basic types of independent variables (IV) in most statistical analysis: between-subjects and within-subjects. A between-subjects IV (also called independent groups) is represented in SPSS by a "dummy variable". There is a single column in SPSS that defines groups by assigning each row to a number corresponding with their group. In the example below, there are three groups defined by the values in the "IV_betweengrps" variable. The data collecting from these groups is in the adjacent column "DV".
No matter how many groups (or levels) your variable has, the IV and DV will always be just two columns in SPSS.
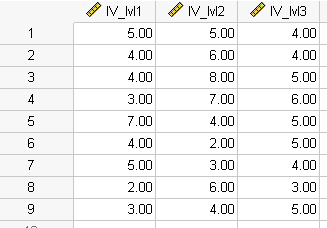
In contrast, a within-subjects IV (also called repeated measures or paired samples) is represented by a separate column in SPSS for each group, or level, of the variable. In the example below, there are three different levels for the IV, so there are three separate columns. Each column contains the data for that particular group.
You will have as many SPSS variables (represented by columns in the data view) as you have groups in your IV.
You should keep these data structures in mind as you start working with your data from Qualtrics. Often the data file from Qualtrics needs to be adjusted and cleaned to match one of above arrangements before any statistical analysis can be done. See below for some specific examples.
Creating an IV from randomized blocks
A common way to create a between-subjects IV in Qualtrics is to use the Randomizer object in the Survey Flow. Below is an example of a 3 x 2 independent groups design.
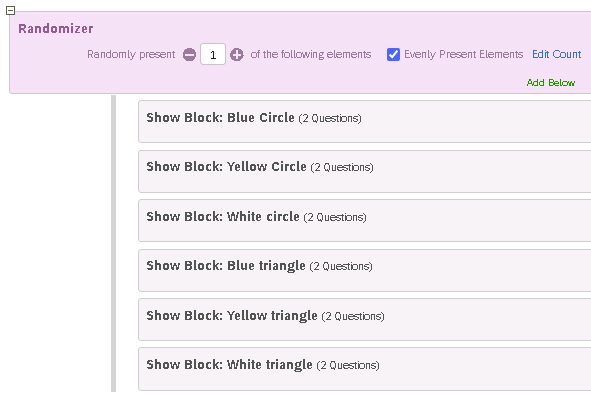
The variables are shape color (blue or yellow or white) and shape type (circle or triangle). Since the randomizer specifies to randomly present 1 of these blocks, each participant will only see 1 of these six possible combinations. Check out this video for a walk-through on how to download this data file and format the IV for a between-subjects analysis.
Once you have your IV set up, check out the section below for getting your DV configured with this type of survey.
Creating an IV from an embedded data object
Embedded data objects are often used in Qualtrics to assign people to different conditions. (Check out my Qualtrics documention for more details.) While these variable settings are exported easily into SPSS, they are usually brought over as string variables. Check out this video for tips on converting those imported variables into numeric variables so that you can use them as IVs.
Creating an IV using median split
Sometimes you have a continuous variable that you would like to use as the independent variable in an ANOVA or t-test. In order to do this, you can calculate the median of your variable and then create a dummy variable in SPSS to sort people based on whether their score is above or below the median. Check out the video below to learn
- How to calculate the median
- How to created your dummy variable
- What to do about cases where people's score is exactly equal to the median
Creating dependent variables
Creating a DV from randomized blocks
As we saw in the above section about IVs, a common way to create a between-subjects design in Qualtrics is to use the Randomizer object in the Survey Flow. Below is an example of a 3 x 2 independent groups design.
The variables are shape color (blue or yellow or white) and shape type (circle or triangle). Since the randomizer specifies to randomly present 1 of these blocks, each participant will only see 1 of these six possible combinations. One challenge of this type of arrangement is that your DV for your between-subjects test may be spread among different Qualtrics variables. Check out this quick video for a tip on merging those into a single SPSS variable using the SUM function.
Reverse scoring
A common technique for creating psychological measures is for some of the questions to be reverse scored. There are several ways to reverse-score variables in SPSS.
- Subtract each participant's response from a value one higher than the maximum value on the scale.
- Use Transform: Recode into Different Variables
- Use Transform: Recode into Same Variables
While all of these get the job done, I recommend the first one, which I demonstrate in the video below.
If you are doing lots of reverse scoring (or any other repetitive tasks), check out my documentation on using SPSS Syntax to speed things up.
Merging variables into subscales
Many surveys ask similar questions and then combine the responses to those questions into a single variable. This is especially true for psychology measures that have been used in previously published research. In these cases, it is critically important to consult the previously published articles to learn how to create these new variables. Some use averages while others use sums. Frequently a single questionnaire can be distilled into multiple different measures called "subscales". Check out the video below for tips on how to combine responses from multiple questions into a single subscale.
If you are doing lots of subscales (or any other repetitive tasks), check out my documentation on using SPSS Syntax to speed things up.
Cronbach's alpha
Whenever you create a variable that combines responses to multiple questions, it is important to test the reliability of the responses using an analysis like Cronbach's alpha. This will assess whether people's responses to the different questions are similar enough to justify combining them. Check out the video below to learn how to do a reliability check in SPSS.
If you are doing lots of subscales (or any other repetitive tasks), check out my documentation on using SPSS Syntax to speed things up.
Using SPSS Syntax
Introduction to SPSS Syntax
Syntax in SPSS is the text based interface that, with a little know-how, can be much more efficient than doing the same things through the menu interface. Although it takes a bit of getting used to, SPSS generates syntax commands every time you do something through the menu interface, so you can use these commands as the basis for creating new syntax. Check out the video below for an introduction to using syntax along with examples for
- Reversing scoring
- Creating subscales
- Calculating Cronbach's alpha
This page is part of the Technical Resources for Students section of the Bates College Psychology Department website.