Bifurcation Diagram from "Orbits", continued
Orbits: Bifurcation Diagram Screen
If you run "orbits" without changing any constants or the Current Function
or the Window Constants (ie, without changing anything), and press
"$" to get into the Bifurcation Diagram, the following picture will be
drawn, from left to right across the screen. The more important parameters
are labeled on the figure, and we will describe how to change things below. 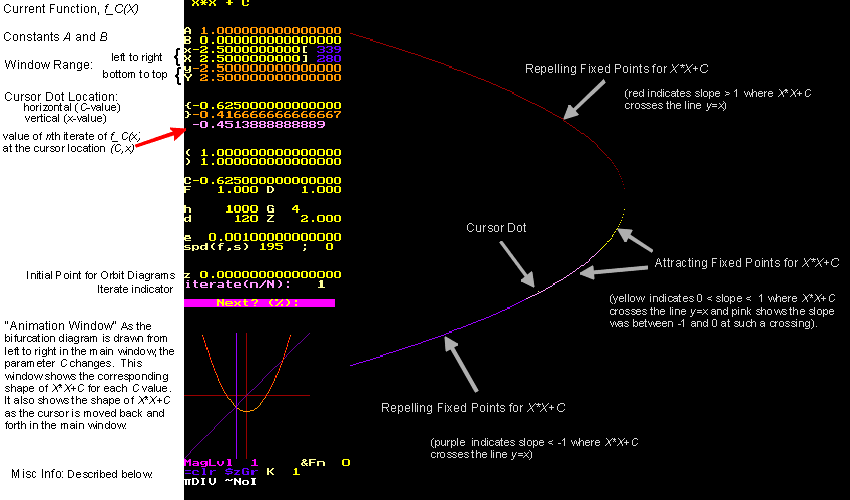
The above picture shows only FIXED points (points whose period is 1).
If x is a fixed point for f_C, then the point (C,x)
appears on the picture above; C values run back and forth, and
x's
run bottom to top.
The colors are based on the slope at x where the graph of f_C
crosses the line y=x. If that slope is greater than one, the fixed point
is repelling, and shown in red. If that slope is between 0 and 1,
the fixed point is attracting, and shown in yellow. If that slope
is between -1 and 0, the fixed point is again attracting, and shown
in pink. If that slope is less than -1, the fixed point is repelling,
and shown in purple.
To see points of, say, period 4, the value of "iterate" needs to be
changed. To increase the value to 4, press "N" three times; to decrease
iterate, type "n". The window ranges can be changed too: Set up the main
window to represent [-2.5, 0.25] as follows: press "x" and then "-2.5"
(Enter), then "X" followed by "0.25" (Enter). Also change "y" and "Y" to
-2.25 and 2.25 respectively. Note that no new picture is drawn; you have
to initiate it by pressing "w" (for "write" the new picture). Superimpose
a grid on the picture by pressing Alt-G. (Hold the alt key down and press
"G"). Do all this and the following picture should appear: (without the
labels)
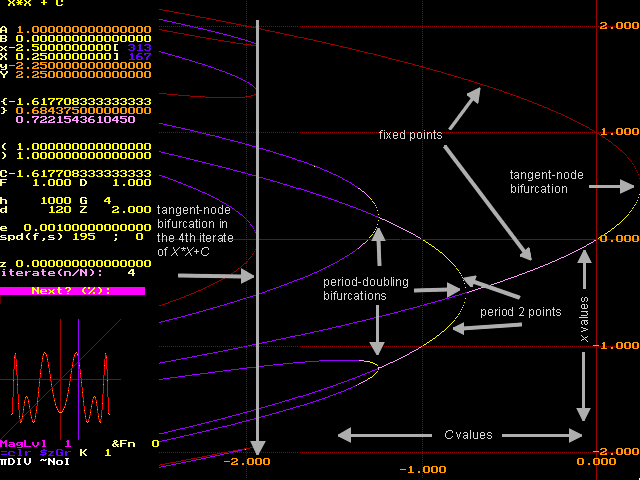
The above picture shows locations of points of period 4. Note that
period 2 and fixed points show up, because they do indeed also have period
4. Also note that the tangent bifurcation in the 4th iterate of X*X+C yields
a pair of period 4 cycles for X*X+C for C<-1.93... A zoom (discussed
below) would show that one of these cycles is attracting for a very small
range of C-values; both sets just appear to be repelling (red &
purple) for all C-values.
The program offers four ways of displaying periodic points: Let N
be the current value of "iterate"; write f ^k to mean the kth
iterate of the Current Function.
-
pDIV Show points of period k, where k
divides N. (The color [red,yellow, pink, purple] used in the bifurcation
diagram is based on the slope where f ^k crosses y=x, where k
is the smallest (ie, prime) period of the point)
-
pALL Show points of period k, where k
is any number from 1 to N. (color chosen as above)
-
pPRM Show points of prime period N
(ie, points with period N and no smaller period) (color chosen as
above but now the only iterate being considered here is N)
-
pORG [from an earlier version of the program]
like pALL, except the slope of f ^N is
used to determine the color. (Note that if k|N, then the absolute
value of the slope of f ^k is greater than 1 <=> the absolute
value of slope of f ^N is greater than 1, at a point of period k).
Pressing Alt-P (hold the "Alt" key down and press "P") cycles through this
list. Note: "orbits" has different coloring schemes. The "K=1" in the lower
corner of the screen indicates color scheme 1 in use (the default setting;
other schemes are described on a separate
page.)
Orbits: Drawing the Orbit Diagram in the Bifurcation Diagram Screen
We turn our attention to drawing the usual "orbit diagram". For X*X+C,
this is produced as follows: For each value of C from left to right, several
members of the orbit of 0 are found, but only the last few are plotted.
If there is an attracting cycle for the given C value, these last few members
of the orbit should've been attracted to the cycle by now; plotting them
shows the location of the attracting cycle. Otherwise, these last few members
should be scattered around if they haven't settled into an attracting cycle
(ie, if the orbit of 0 is chaotic or if the orbit of 0 has "escaped to
infinity").
"orbits" has three controls here: "h" determines how many members of
the orbit of 0 are calculated BEFORE any of them are plotted (h=1000 by
default) and "d" determines how many subsequent members after this
are then plotted. (d=120 by default). Finally, "z" is used for the initial
point (the critical number 0 in this case). Press "O" to superimpose the
orbit diagram on the above picture. You should see the following:
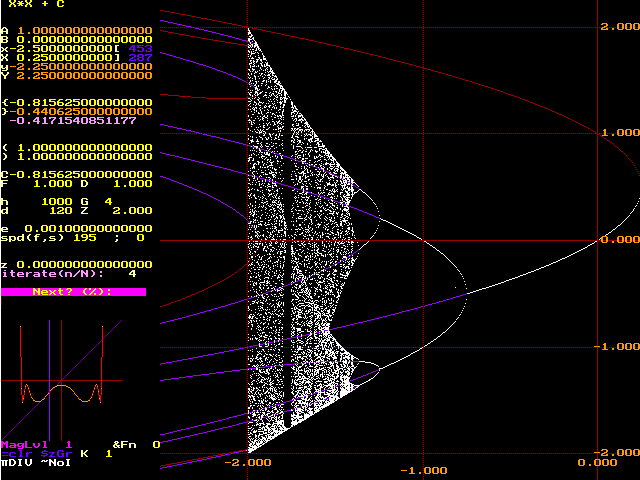
The pink and yellow (attracting) periodic points from the bifurcation
diagram have been covered (appropriately) by white in the orbit diagram;
regions of chaotic behavior appear, and the locations of repelling cycles
of periods 1,2 and 4 are still visible.
Orbits: Zooming Into the Bifurcation and Orbit Diagrams
The orbits program allows for three kinds of zooms: Stretches, Pulls, and
Magnification. A Stretch zooms in in the horizontal direction only, leaving
the vertical direction unchanged. A Pull zooms the vertical direction,
leaving the horizontal direction alone. And a Magnification zooms in both
horizontally and vertically. The commands are "S", "P", and "M" respectively.
The zoom is always made around whereever the cursor is. That is, to zoom
in on an interesting part of the picture, put the cursor there, and press
one of "S", "P", or "M". The values of x,X,y,Y will be updated, and the
cursor will reappear in the center of the screen. You must press "w" or
"O" to write a new bifurcation diagram or Orbit diagram. The "zoom - level"
is indicated by MagLvL, lower left part of the screen. To come up out of
a zoom by one level, press "U". You again have to press "w" or "O" to redraw
the picture.
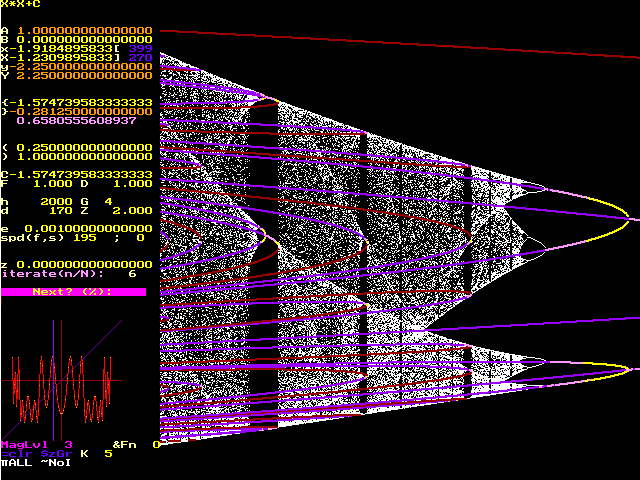
What follows results from two "stretches" near the so-called period-3
window in the usual orbit diagram; the bifurcation diagram for points of
periods less than or equal to 6 are superimposed. You can clearly see the
period-doubling bifurcation from 3 to 6, and the attracting cycle in the
period five-window to the right. Note the repelling curves passing through
"Misiurewicz" points: At such a C-value, the orbit of 0 is eventually periodic,
to a repelling cycle; we can see which repelling cycle that is.
Orbits: Miscellaneous and Details for the Bifurcation Diagram Screen
To return to the Main Screen, press "q" to stop the current plot, and then
F10.
To draw the orbit of the x (vertical) coordinate of the point at the
cursor, press the space bar. Press "g" to make it go continuously. Press
the space-bar to pause it. Press "q" to stop it altogether.
"c" clears the screen.
alt-g draws the grid; "(" and ")" set the horizontal and vertical spacing
of gridlines.
F5 can be used to change the Current Function from within this part
of the program (you don't need to go back to the Main Screen) (remember
to use capital X for the variable, and capital C for the parameter).
The Zoom-Factor is set by "Z". By default, it's 2 (Zoom in by a factor
of 2 in each direction).
Normally, "orbits" must compute the value of the Nth iterate
of the Current Function at each pixel on the vertical strip above
each given C-value; that's 480 calculations per C value. To divide the
strip into 4 times as many subintervals, set "F" to 0.25. This may catch
more crossings of f ^N and the line y=x, at the expense of waiting
4 times longer for the picture to appear.
Normally, "orbits" checks 480 C-values from left to right across the
screen. To divide this horizontal interval into 4 times as many
subintervals, set "D" to 0.25. This plots more points near period doubling
and tangent node bifurcations, again, at the expense of waiting 4 times
longer for the picture to appear.
For a fast left to right sketch, use "W" instead of "w". Points are
plotted every "G" pixels.
For different coloring schemes, set "K" to different values, from 0
to 8. Enter a value of "K" directly; it also just increments each time
you press "K". We'll devote a separate page to describing the schemes;
click
here for a more complete description.
alt-F8 will cycle through four different built-in palettes, affecting
ALL colors in use by the program. These palettes are labeled A, B, C, and
D. The palette currently in use is shown at the very bottom left corner
of the screen. [the images above were created before this palette listing
was added to the program].
-
The standard one is (A) and is the one used to produce all the figures
in these HTML files. DON'T use it for printing, because you'll waste a
lot of black ink and the picture will be awful. Instead, use palette (B).
-
(B) is the same as (A) except that black and white are reversed;
in particular the background becomes white. Use this palette for printing,
in the following way: Once a picture is to your liking, press the "PrintScreen"
key on the top row of your keyboard. This "dumps" the graphics image into
the Windows clipboard. Then using a Windows program like "Paint",
make a new file from the clipboard's contents and send it off to your printer.
Note that yellow may be hard to see; I hope to make the color choices more
flexible in a future version.
-
(C) and (D) also use a white background but different color schemes for
the rest of what's drawn,
-
Press alt-F8 to cycle through the list: A-B-C-D-A-B...etc.
alt-F9 draws a frame around the picture
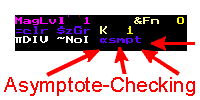 Known BUG! If your function f has a vertical asymptote at some value V,
the bifurcation diagram algorithm may detect a "crossing" of f with the
line y=x when it samples two x values, one on either side of the asymptote
V, if f(one x value) is a big positive number and f(the other x value)
is a big negative one. What's plotted therefore is the location of the
asymptote, not a genuine periodic point. The newer version of "orbits"
has a switch which when turned on checks for such a crossing (at the expense
of taking a little more time). The switch is "asmpt" and is toggled by
pressing Alt-A. Try f_C(X)=1/(X*X+C) for an interesting example; see if
you can spot the curve indicating an asymptote instead of a periodic point
for f_C.
"=clr" is a switch that toggles when you press "=". just make sure it's
off (dark blue) "$zGr" is a switch that toggles when you press "$"; leave
it off too(dark blue) . It's for drawing the very hi-resolution pictures
found in our CMJ article, meant to be printed on a Canon BJC-4000 series
printer. "&Fn" cycles between the user's Current Function (&Fn=0),
or two other functions built-in to the program to increase speed. The built-in
functions are X*X+C (&Fn=1) and C*sin(X) (&Fn=2). Press "&"
to cycle through these three values, but leave it on &Fn=0 to
avoid confusion. It's buggy: The little animation window always uses the
Current Function, for example.


 Known BUG! If your function f has a vertical asymptote at some value V,
the bifurcation diagram algorithm may detect a "crossing" of f with the
line y=x when it samples two x values, one on either side of the asymptote
V, if f(one x value) is a big positive number and f(the other x value)
is a big negative one. What's plotted therefore is the location of the
asymptote, not a genuine periodic point. The newer version of "orbits"
has a switch which when turned on checks for such a crossing (at the expense
of taking a little more time). The switch is "asmpt" and is toggled by
pressing Alt-A. Try f_C(X)=1/(X*X+C) for an interesting example; see if
you can spot the curve indicating an asymptote instead of a periodic point
for f_C.